
-
Website
-
3min Explainer Walkthrough

- Generate a Design
-
Page Management

-
Page Editing

-
Form Builder

- Updating Your Navigation Menu
- Creating Page Redirectors
- Posts Management
-
Search Engine Optimization

- Setting Up Google Marketing Tools
- Setting Up Meta Pixel & E-commerce Tracking
- Setting Up Microsoft Marketing Tools
- Setting Up Linkedin Insight Tag
- Optimizing Images For Web
-
Analytics

- Third Party Embed Code
- Special Files
-
3min Explainer Walkthrough
- Contacts
- Marketing
- Commerce
- Apps
-
Settings and Config
- Going Live
- Billing
- Domain Health Checker
- Managing Administrators
- Registering a Domain Name
- Changing Your Domain Name
- The Role of DNS Records Explained
- Backing Up Your Website
- Choosing an E-mail Host
- Hosting Email With Oncord
- Setting Up Gmail Hosting
- Setting Up Microsoft 365 E-mail Hosting
- Setting Up Sub Domains
- Hosting a Sub-Site
- Changes
Sales Reports
Tracking sales performance is essential for making informed business decisions. With Oncord’s built-in reporting tools, you can easily access key sales metrics without relying on third-party plugins or add-ons.
From monthly revenue summaries to product-level insights and payment method tracking, Oncord offers a streamlined reporting experience directly within the platform.
In this guide, we’ll walk you through how to access the Sales Reports and explain the purpose and functionality of each report available in the Commerce module.
Accessing Sales Reports
To view your sales reports in Oncord:
- Go to your Dashboard.
- Navigate to Commerce > Sales.
- Click the three-dot button at the top of the page.
- Select Reports from the dropdown menu.
You’ll now see a list of available report types:
- Monthly Receipts
- Products Sold by Date
- Payment Methods by Date
Report Overview
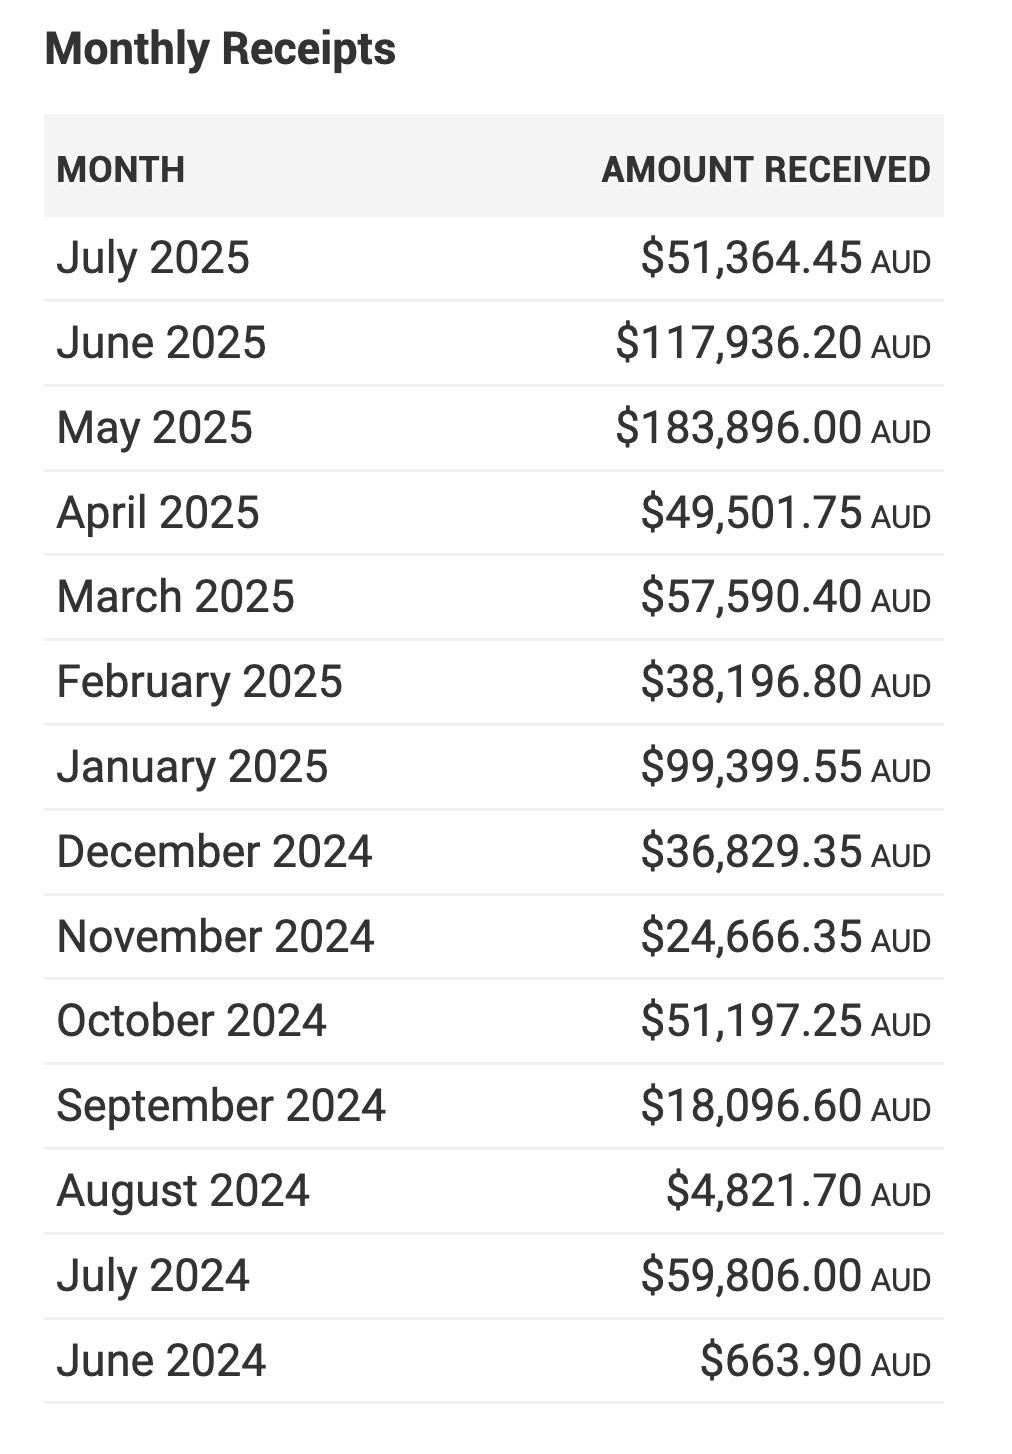
1. Monthly Receipts
This report displays a list of receipt totals grouped by month. It provides a high-level overview of the total revenue received each month, helping you understand overall business performance and spot trends over time.
You can:
- View month-by-month totals
- Export the report data for further analysis or accounting use
2. Products Sold by Date
This report shows a breakdown of all products sold within a selected date range. You can filter by week, month, year, or financial year and group the results by product or by order options.
Additional features include:
- Filtering by product category.
- Viewing quantities sold and total revenue per product
- Selecting a tax type or product grouping for more refined reporting
This tool is ideal for tracking inventory performance, identifying top sellers, and analysing customer purchasing patterns.
3. Payment Methods by Date
This report provides a list of payment methods used over a specific date range. You can see totals for each method and filter the results by the administrator who received the payment.
This report helps you:
- Understand how customers are paying
- Monitor trends in payment preferences
- Audit staff-level sales activity if needed
You can also print the report directly for physical records or meetings.