
-
Website
-
3min Explainer Walkthrough

- Generate a Design
-
Page Management

-
Page Editing

-
Form Builder

- Updating Your Navigation Menu
- Creating Page Redirectors
- Posts Management
-
Search Engine Optimization (SEO)

- Setting Up Google Marketing Tools
- Setting Up Meta Pixel & E-commerce Tracking
- Setting Up Microsoft Marketing Tools
- Setting Up Reddit Pixel and E-commerce Tracking
- Setting Up Linkedin Insight Tag
- Optimizing Images For Web
-
Analytics

- Third Party Embed Code
- Special Files
-
3min Explainer Walkthrough
- Contacts
- Marketing
- Commerce
- Apps
-
Settings and Config
- Going Live
- Billing
- Domain Health Checker
- Managing Administrators
- Registering a Domain Name
- Changing Your Domain Name
- The Role of DNS Records Explained
- Backing Up Your Website
- Choosing an E-mail Host
- Hosting Email With Oncord
- Setting Up Gmail Hosting
- Setting Up Microsoft 365 E-mail Hosting
- Setting Up Sub Domains
- Hosting a Sub-Site
- Changes
- Website
-
-
3min Explainer Walkthrough
- Generate a Design
-
Page Management
-
Page Editing
-
Form Builder
- Updating Your Navigation Menu
- Creating Page Redirectors
- Posts Management
-
Search Engine Optimization (SEO)
- Setting Up Google Marketing Tools
- Setting Up Meta Pixel & E-commerce Tracking
- Setting Up Microsoft Marketing Tools
- Setting Up Reddit Pixel and E-commerce Tracking
- Setting Up Linkedin Insight Tag
- Optimizing Images For Web
-
Analytics
- Third Party Embed Code
- Special Files
-
3min Explainer Walkthrough
- Contacts
- Marketing
- Commerce
- Apps
- Settings and Config
Analytics
Learn how to access your website analytics data.
Understanding Analytics
You can use Analytics to understand how visitors are finding and using your website. This includes traffic volume, referrers, popular pages, and device usage. This guide explains where to find Analytics in Oncord and what each metric means.
Access Analytics
To view your website analytics:
- Log in to your Dashboard
- Go to Dashboard > Website > Analytics
The analytics page will load data for your website. If your site receives a high volume of traffic, this may take a moment.
By default, data is shown for the last 30 days. You can change the date range using the date selector.
How Analytics Data is Calculated
Oncord automatically filters out robot and machine traffic. Visits from logged-in administrators are also excluded.
This helps ensure the data reflects real visitor behaviour.
Analytics Metrics Explained
Analytics includes a comparison indicator for key metrics.
The comparison shows how each metric has changed compared to the previous period of the same length as the currently selected date range.
For example:
- If you are viewing the last 30 days, the comparison is against the previous 30 days
- If you are viewing a week, the comparison is against the previous week
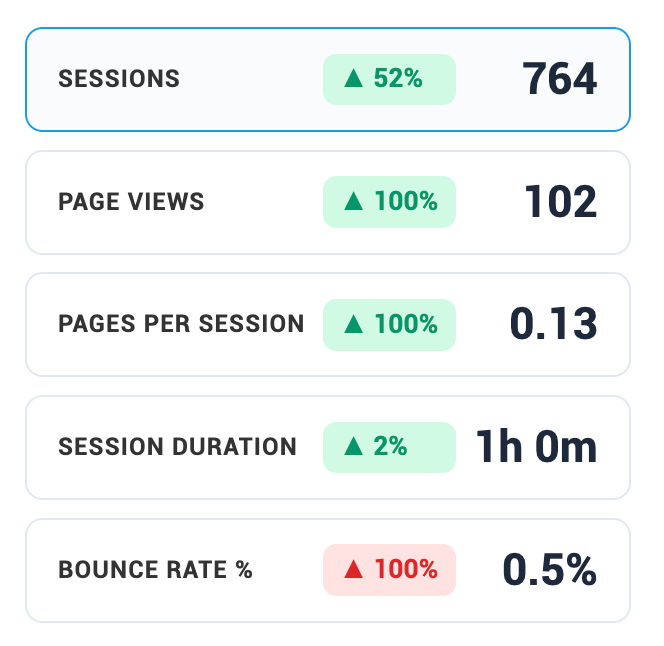
Sessions
A session represents a visit from a unique user.
- A session starts when a visitor arrives on your website
- If the visitor is inactive for around 4 hours, the session ends
- Returning within that time counts as the same session
Sessions are shown in blue on the analytics graph and on the Dashboard home screen.
Page Views
A page view is counted each time a page loads.
Example:
If a visitor navigates Home > Services > About > Services, this counts as four page views.
Pages per Session
The average number of pages viewed during a single session.
Higher values usually indicate stronger engagement.
Bounce Rate
A bounce occurs when a visitor:
- Arrives on your website
- Leaves without clicking or viewing another page
Bounce rate is the percentage of sessions that are bounces.
Lower bounce rates generally indicate better engagement.
Top Referrers
The Top referrers section reveals where your website traffic originates, showing you which external websites and search engines are sending visitors to your site. This data helps you understand your most valuable traffic sources and identify successful marketing channels or partnerships.
Top Landing Pages and Exit Pages
- Top landing pages show which pages visitors arrive on first
- Top exit pages show where visitors most commonly leave your website
This data can help identify strong entry points and pages that may need improvement.
Mobile Usage and Browser Data
This section shows:
- Mobile vs desktop usage
- Browsers used by visitors
Use this data to confirm your website is performing well across devices and browsers.
UTM Parameters
UTM parameters are tags you can add to URLs to track marketing campaigns and traffic sources in your analytics.
View Metrics Charts as Trend or Table
Each analytics chart can be viewed as either a Trend or a Table view.
This lets you switch between visual trends over time and precise numeric values.
View Trend/Table
- Go to Dashboard > Website > Analytics
- Locate a chart (for example, Traffic Channels or Top Referrers)
-
Select the
/ icon at the top right of the chart
Trend View
Trend view displays data as a line chart.
Use this view to:
- Identify spikes or drops in traffic
- Compare performance over time
- See the impact of annotations such as campaigns or events
Table View
Table view displays the same data in a list format.
Use this view to:
- See exact session counts
- Compare channels or sources side by side
- Quickly scan detailed values without a graph
Managing Annotations
Annotations are labels that appear on all charts in Analytics.
They are useful for recording marketing events and visualising their impact on traffic and engagement.
You can use annotations to:
- Mark campaign launches, emails, ads, or promotions
- Note website changes or content updates
- Explain spikes or drops in traffic when reviewing reports later
Access Annotations
To manage annotations:
- Log in to your Dashboard
- Go to Dashboard > Website > Analytics
- Select Manage Annotations at the top of the page
This opens the Analytics Annotations page, where all annotations are listed and managed.
Create a New Annotation
To create an annotation from the annotations page:
- Select New Annotation at the top of the page
- Enter the Event date
- Enter the Event title (up to 16 characters)
- Enter Event details (shown when hovering on the chart)
- Select Save Annotation
The annotation will appear on all analytics charts for the selected date.
Shortcut - You can also create annotations directly from the analytics panel:
- Select a metric from the left-hand metrics list
- Select New Annotation at the top right of the chart
- Enter the event details and save
This is useful when reviewing data and quickly recording what caused a change.
Email Analytics Reports
You can configure Analytics to send automated email reports to selected recipients. These reports summarise key website metrics such as traffic, engagement, and visitor behaviour.
To enable Email Analytics Reports function:
- Log in to your Dashboard
- Go to Dashboard > Website > Analytics
- Select Email Reports at the top of the page
- Turn Enable Reports on
Report frequency
Choose how often reports are sent: Daily/Weekly/Monthly.
Recipients
- Enter the email addresses that should receive the report
- Separate multiple email addresses with commas
- Leave this field blank to use the account contact email
Report metrics
Select which metrics to include in your report.
Preview and save
- Review the Preview Report to see how the email will appear
- Click Save Configuration to apply your changes
Reports will be sent automatically based on the selected schedule.
If you still have questions, please message us at www.oncord.com/company/contact-us/ and we will get back to you as soon as we can.